
Weekly Market Commentary
March 9th, 2026
Week in Review
Last week delivered many important macroeconomic releases, giving investors insight into an evolving U.S. economic landscape. In addition, the conflict in Iran has escalated dramatically, adding significant economic concerns.
Manufacturing data reflected moderate expansion. The S&P Global U.S. Manufacturing Purchasing Managers’ Index (PMI) came in at 51.6, slightly above the 51.2 forecast, marking the seventh consecutive month of expansion. However, this was down from January’s reading of 53.4, signaling softer momentum and less new orders. For investors, this reinforces a narrative of sluggish industrial activity.
ADP Nonfarm Employment increased by 63,000 in February, above the consensus estimate of 50,000. This growth within the private sector was concentrated in construction, education, and health services. The upside surprise here suggests that labor cooling remains gradual, tempering expectations of imminent Federal Reserve easing.
The S&P Global Services PMI for February came in at 51.7, lower than the 52.3 expected. This decline was due to slower new orders, weaker export demand, and difficult trading conditions. However, the services sector continued to grow, with ISM Services PMI reporting a reading of 54.0, the 20th consecutive month of expansion.
The headline payrolls print was the largest shock of the week. Nonfarm payrolls fell by 92,000, far below the expected increase of 58,000, with unemployment rising to 4.4%. This raises concerns about labor-market softening, though wage growth has remained firm, complicating Federal Reserve policy expectations.
War in Iran
On the geopolitical front, joint U.S. and Israeli strikes on Iran began on February 28, 2026, targeting senior leadership, nuclear infrastructure, missile sites and strategic military assets. The Supreme Leader of Iran, Ayatollah Ali Khamenei, was killed in these strikes. Iran has retaliated with sustained missile and drone attacks targeting U.S. bases, Israel and Gulf nations allied with the U.S. President Trump has signaled that the campaign against Iran will continue for “as long as it takes.”
Iran has moved to effectively close the Strait of Hormuz, severely restricting a waterway responsible for roughly 20% of global oil and natural gas shipments. Traffic has dropped by more than 80%, with major firms suspending operations and insurers withdrawing coverage. This has led to oil markets pricing in a multi-week disruption. In addition, Qatar’s energy minister Saad al-Kaabi, said the ongoing conflict could force Gulf oil exporters to halt production within days.
Effects of this conflict have been felt almost immediately. On Friday, WTI oil prices surged 12% to $90.90 a barrel, and Brent oil rose 8.5% to $92.69 a barrel. Weekly gains were 36% for WTI and 27% for Brent, the largest percentage increases on record since 1983 and 1991, respectively. Large increases in the price of crude oil have in turn pushed gasoline prices higher, as well. These price increases have rekindled inflation fears, and markets have begun to reduce bets that the Federal Reserve will ease rates further despite the weakness in this week’s jobs report.
This conflict is broader and more intense than prior Iran flare-ups. Analysts suggest the war could last up to eight weeks, but if history is any guide this conflict can last far longer than most expect. With that said, even a short conflict could lead to lasting market dislocation. If the strait remains impaired, oil prices may rise further, threatening global growth. Overall, the conflict remains highly unstable, and we believe markets will continue to price in elevated geopolitical risk until a clear path toward de-escalation emerges.
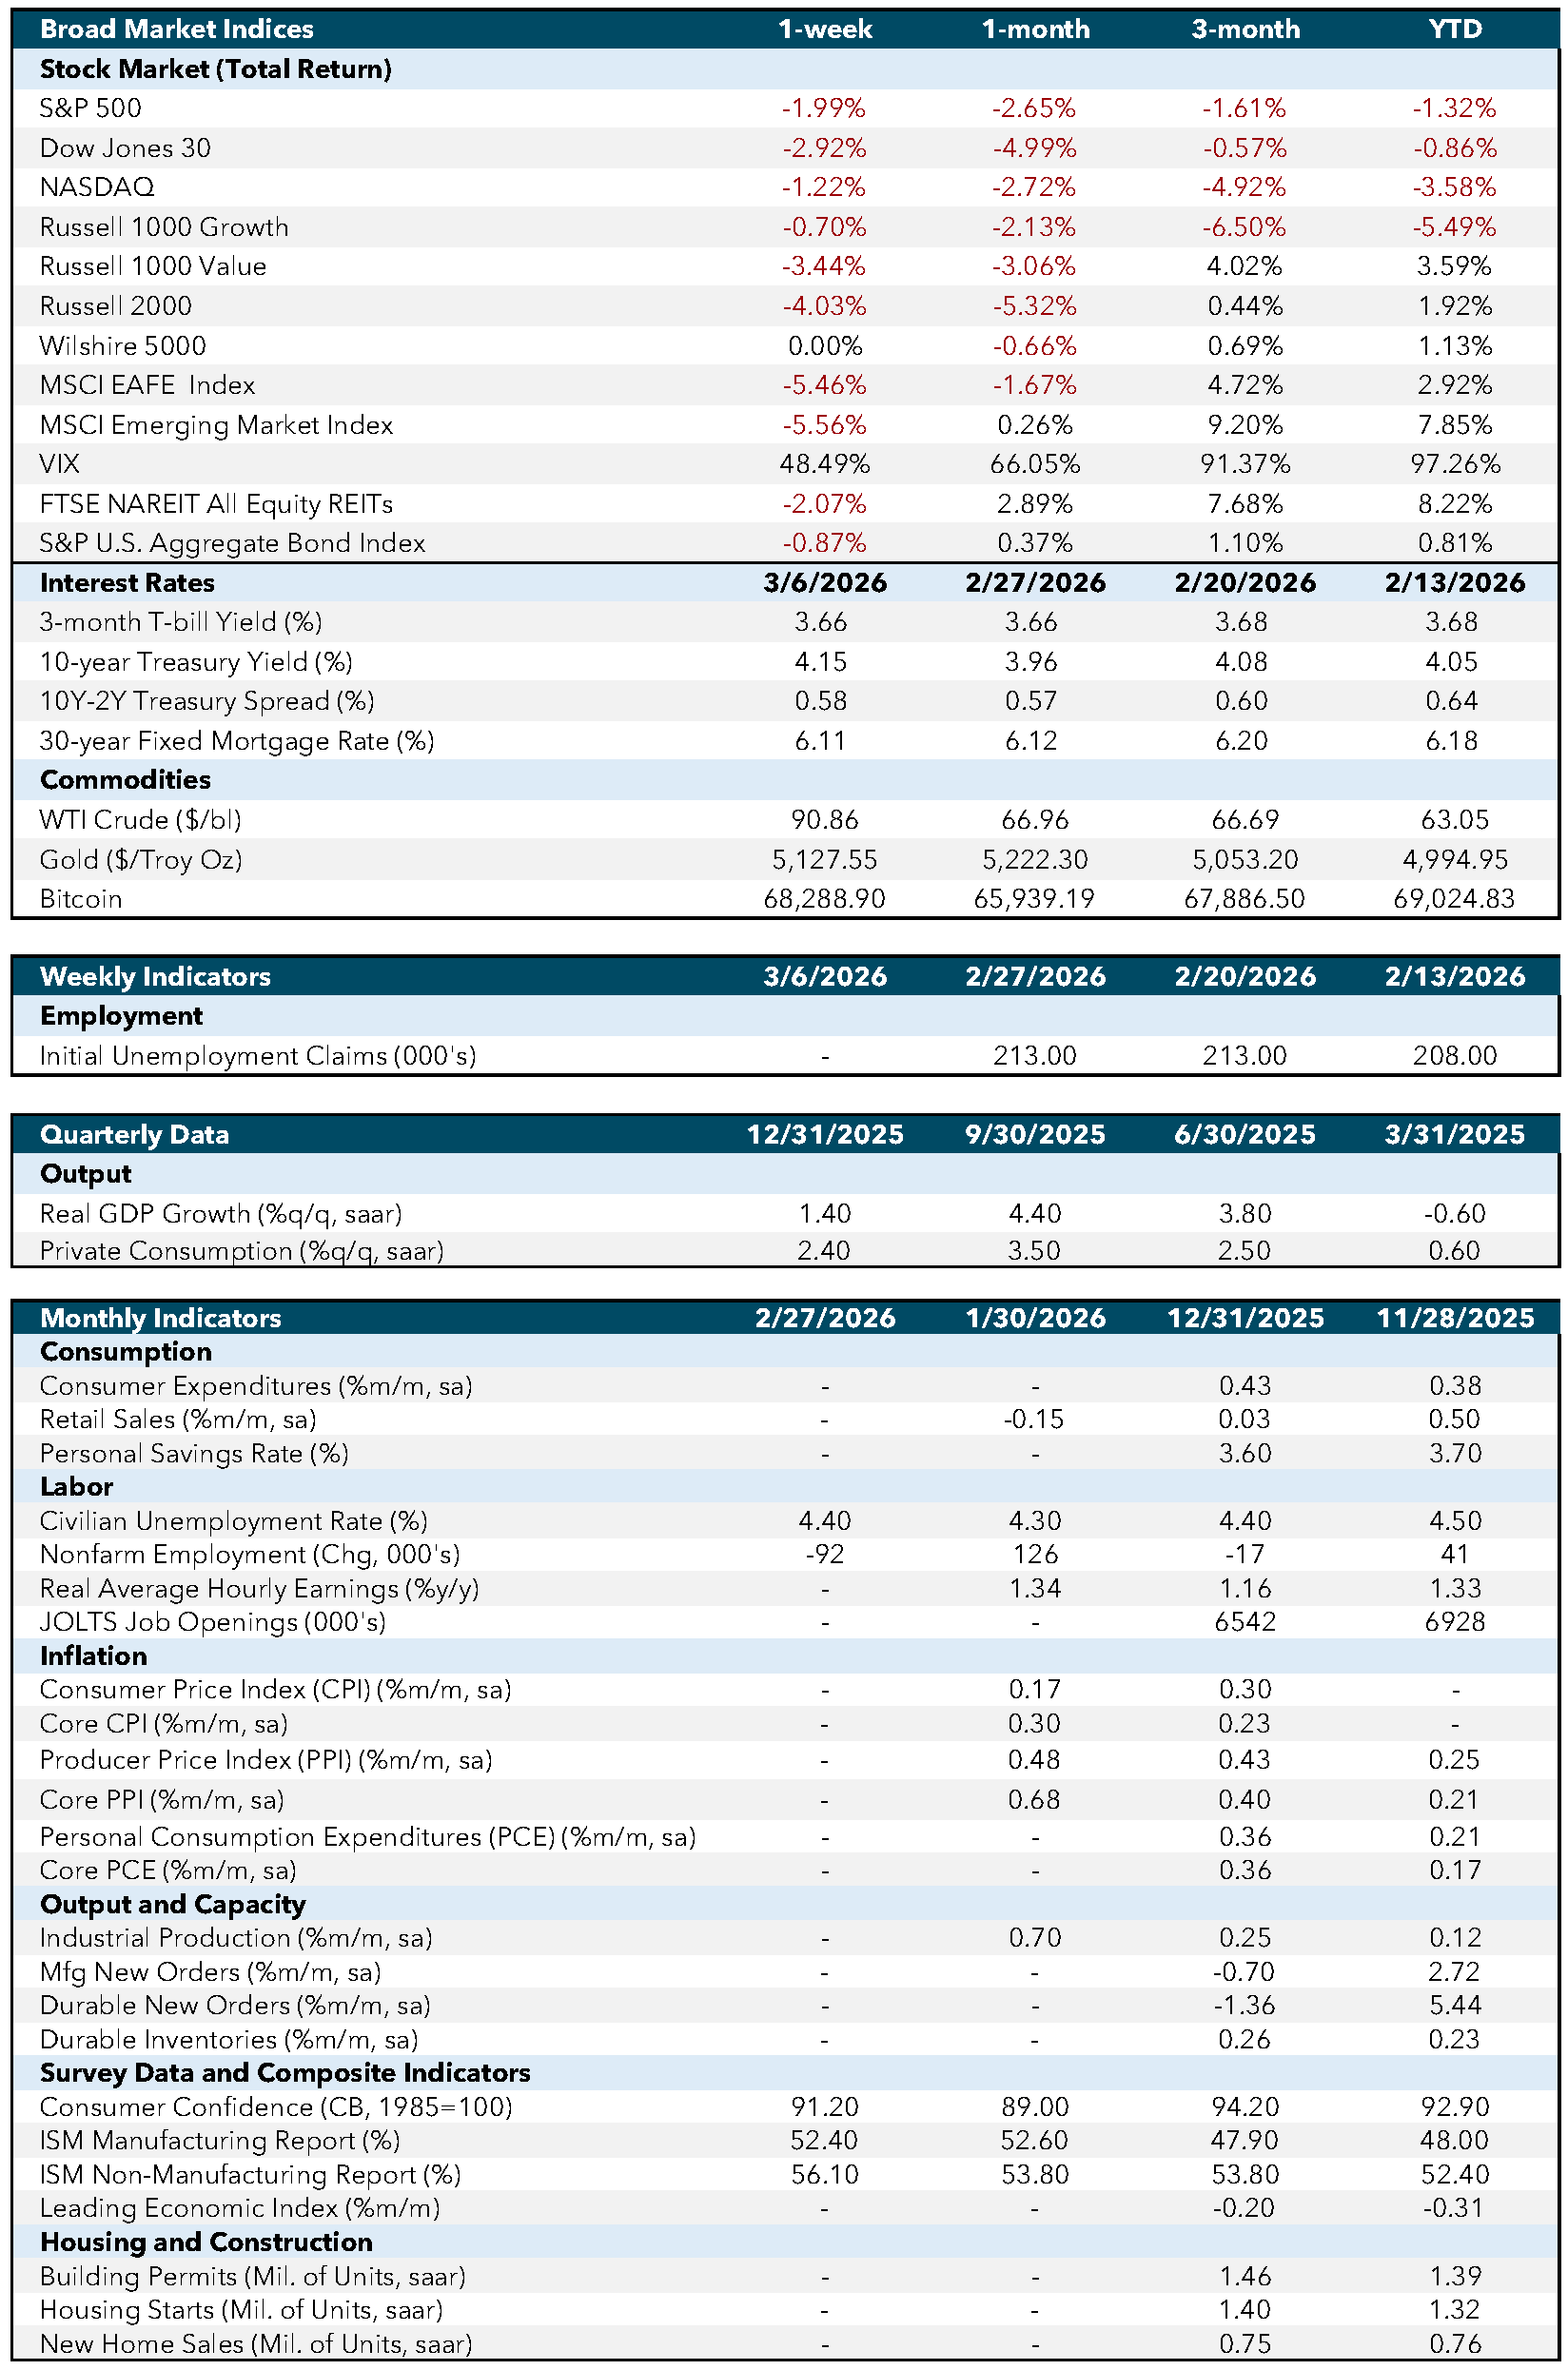
Economic and Capital Markets Dashboard
Week Ahead…

The week ahead will include many data releases, with a focus on housing, inflation, trade and consumer sentiment. This data will be used by investors to shape market sentiment and interest rate expectations. Investors will also be watching for any developments regarding the conflict in Iran.
Existing Home Sales on Tuesday will provide a key read on housing demand. February’s sales volume will provide a gauge on the effects of shifting mortgage rates and affordability pressures. Any signs of stabilization could support a firmer outlook for household formation and related sectors.
Wednesday will bring the February Consumer Price Index (CPI) report, a closely watched release. With inflation being a primary driver of Federal Reserve policy, investors will dissect both headline and core components. Markets will be looking for confirmation that disinflation trends are durable, especially within the shelter and services sectors.
Thursday will bring the U.S. trade balance, which will provide clarity on external demand dynamics. Investors will focus on the breakdown between the goods and services trade and hope for stabilization after months of global softness. This can also influence the tracking estimates of first-quarter gross domestic product (GDP).
Friday is the busiest day of the week, with several important releases. January Personal Income and Spending, Q4 GDP (second estimate) and the University of Michigan Consumer Sentiment for March. These indicators will provide updated insight into income growth, real spending trends, and consumer attitudes as elevated borrowing costs continue to influence household behavior. The GDP update will also refine views on late-2025 momentum.
Economic Indicators:
- CPI: Consumer Price Index measures the average change in prices paid by consumers for goods and services over time. Source: Bureau of Labor Statistics.
- Core CPI: Core Consumer Price Index excludes food and energy prices to provide a clearer picture of long-term inflation trends. Source: Bureau of Labor Statistics.
- PPI: Producer Price Index measures the average change in selling prices received by domestic producers for their output. Source: Bureau of Labor Statistics.
- Core PPI: Core Producer Price Index excludes food and energy prices to provide a clearer picture of long-term inflation trends. Source: Bureau of Labor Statistics.
- PCE: Personal Consumption Expenditures measure the average change in prices paid by consumers for goods and services. Source: Bureau of Economic Analysis.
- Core PCE: Core Personal Consumption Expenditures exclude food and energy prices to provide a clearer picture of long-term inflation trends. Source: Bureau of Economic Analysis.
- Industrial Production: Measures the output of the industrial sector, including manufacturing, mining, and utilities. Source: Federal Reserve.
- Mfg New Orders: Measures the value of new orders placed with manufacturers for durable and non-durable goods. Source: Census Bureau.
- Durable New Orders: Measures the value of new orders placed with manufacturers of durable goods. Source: Census Bureau.
- Durable Inventories: Measures the value of inventories held by manufacturers for durable goods. Source: Census Bureau.
- Consumer Confidence (CB, 1985=100): Measures the degree of optimism that consumers feel about the overall state of the economy and their personal financial situation. Source: Conference Board.
- ISM Manufacturing Report: Measures the economic health of the manufacturing sector based on surveys of purchasing managers. Source: Institute for Supply Management.
- ISM Non-Manufacturing Report: Measures the economic health of the non-manufacturing sector based on surveys of purchasing managers. Source: Institute for Supply Management.
- Leading Economic Index: Measures overall economic activity and predicts future economic trends. Source: Conference Board.
- Building Permits (Mil. of Units, saar): Measures the number of new residential building permits issued. Source: Census Bureau.
- Housing Starts (Mil. of Units, saar): Measures the number of new residential construction projects that have begun. Source: Census Bureau.
- New Home Sales (Mil. of Units, saar): Measures the number of newly constructed homes sold. Source: Census Bureau.
- SA: Seasonally adjusted.
- SAAR: Seasonally adjusted annual rate.
Market Indices & Indicators:
- S&P 500: A market-capitalization-weighted index of 500 leading publicly traded companies in the U.S., widely regarded as one of the best gauges of large U.S. stocks and the stock market overall.
- Dow Jones 30: Also known as the Dow Jones Industrial Average, it tracks the share price performance of 30 large, publicly traded U.S. companies, serving as a barometer of the stock market and economy.
- NASDAQ: The world’s first electronic stock exchange, primarily listing technology giants and operating 29 markets globally.
- Russell 1000 Growth: Measures the performance of large-cap growth segment of the U.S. equity universe, including companies with higher price-to-book ratios and growth metrics.
- Russell 1000 Value: Measures the performance of large-cap value segment of the U.S. equity universe, including companies with lower price-to-book ratios and growth metrics.
- Russell 2000: A market index composed of 2,000 small-cap companies, widely used as a benchmark for small-cap mutual funds.
- Wilshire 5000: A market-capitalization-weighted index capturing the performance of all American stocks actively traded in the U.S., representing the broadest measure of the U.S. stock market.
- MSCI EAFE Index: An equity index capturing large and mid-cap representation across developed markets countries around the world, excluding the U.S. and Canada.
- MSCI Emerging Market Index: Captures large and mid-cap representation across emerging markets countries, covering approximately 85% of the free float-adjusted market capitalization in each country.
- VIX: The CBOE Volatility Index measures the market’s expectations for volatility over the coming 30 days, often referred to as the “fear gauge.”
- FTSE NAREIT All Equity REITs: Measures the performance of all publicly traded equity real estate investment trusts (REITs) listed in the U.S., excluding mortgage REITs.
- S&P U.S. Aggregate Bond Index: Represents the performance of the U.S. investment-grade bond market, including government, corporate, mortgage-backed, and asset-backed securities.
- 3-Month T-bill Yield (%): The yield on U.S. Treasury bills with a maturity of three months, reflecting short-term interest rates.
- 10-Year Treasury Yield (%): The yield on U.S. Treasury bonds with a maturity of ten years, reflecting long-term interest rates.
- 10Y-2Y Treasury Spread (%): The difference between the yields on 10-year and 2-year U.S. Treasury bonds, often used as an indicator of economic expectations.
- WTI Crude ($/bl): The price per barrel of West Texas Intermediate crude oil, a benchmark for U.S. oil prices.
- Gold ($/Troy Oz): The price per troy ounce of gold, a standard measure for gold prices.
- Bitcoin: A decentralized digital currency without a central bank or single administrator, which can be sent from user to user on the peer-to-peer bitcoin network.
This content was developed by Cambridge from sources believed to be reliable. This content is provided for informational purposes only and should not be construed or acted upon as individualized investment advice. It should not be considered a recommendation or solicitation. Information is subject to change. Any forward-looking statements are based on assumptions, may not materialize, and are subject to revision without notice. The information in this material is not intended as tax or legal advice.
Investing involves risk. Depending on the different types of investments there may be varying degrees of risk. Socially responsible investing does not guarantee any amount of success. Clients and prospective clients should be prepared to bear investment loss including loss of original principal. Indices mentioned are unmanaged and cannot be invested into directly. Past performance is not a guarantee of future results.
The Dow Jones Industrial Average (DJIA) is a price-weighted index composed of 30 widely traded blue-chip U.S. common stocks. The S&P 500 is a market-cap weighted index composed of the common stocks of 500 leading companies in leading industries of the U.S. economy. The NASDAQ Composite Index is a market-value weighted index of all common stocks listed on the NASDAQ stock exchange.
Securities offered through Cambridge Investment Research, Inc., a broker-dealer, member FINRA/SIPC, and investment advisory services offered through Cambridge Investment Research Advisors, Inc., a Registered Investment Adviser. Both are wholly-owned subsidiaries of Cambridge Investment Group, Inc. V.CIR.0326-0860